In December, the average PM2.5 concentration in 339 prefecture-level and above cities nationwide was 43.1 micrograms per cubic meter, down 6.3% year-on-year; the average PM10 concentration was 66 micrograms per cubic meter, down 7.0% year-on-year; the average O3 concentration was 85 micrograms per cubic meter, up 3.7% year-on-year; the average SO2 concentration was 9 micrograms per cubic meter, down 10.0% year-on-year; the average NO2 concentration was 31 micrograms per cubic meter, down 3.1% year-on-year; and the average concentration of CO was 1.0 milligrams per cubic meter, down 23.1% year-on-year.
In December, the average proportion of good air quality days in 339 prefectural-level and above cities nationwide was 88.0%, up 6.0 percentage points year-on-year; the average proportion of days with heavy or above pollution was 0.2%, down 3.1 percentage points year-on-year. The average proportion of days exceeding the standard caused by dusty weather was 0.3%, and there were no days of heavy and above pollution.
From January to December, the average concentration of PM2.5 in 339 prefectural-level and above cities nationwide was 29.3 micrograms per cubic meter, a year-on-year decrease of 2.7%; the average concentration of PM10 was 49 micrograms per cubic meter, a year-on-year decrease of 7.5%; the average concentration of O3 was 144 micrograms per cubic meter, a year-on-year flat; the average concentration of SO2 was 8 micrograms per cubic meter, a year-on-year decrease of 11.1%; average concentration of NO2 was 20 micrograms per cubic meter, down 9.1% year-on-year; and average concentration of CO was 1.0 milligrams per cubic meter, flat year-on-year.
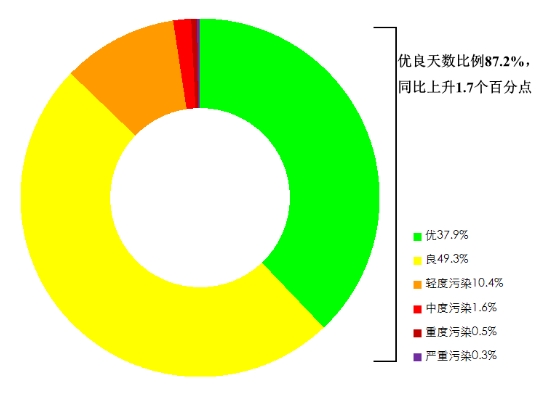
From January to December, the average proportion of good air quality days in 339 prefectural-level and above cities nationwide was 87.2%, up 1.7 percentage points year-on-year; the average proportion of days with heavy and above pollution was 0.9%, down 0.7 percentage points year-on-year. The average proportion of days exceeding the standard caused by dusty weather was 1.9%, of which the proportion of days with severe or above pollution was 0.4%.

Proportion of days at various levels in 339 cities at prefecture level and above nationwide, January-December 2024
Top 20 and bottom 20 cities of 168 key cities in terms of air quality, January-December 2024
From January to December, among the 168 key cities: the top 20 cities with better air quality are, in order, Lhasa, Haikou, Xiamen, Guiyang, Fuzhou, Zhoushan, Huangshan, Huizhou, Lishui, Shenzhen, Kunming, Zhangjiakou, Zhuhai, Zhongshan, Taizhou, Zhaoqing, Nanning, Wenzhou, Dongguan, and Ya'an City; and the bottom 20 cities with worse air quality are, in order, Lanzhou, Xinxiang, Xianyang The bottom 20 cities with poor air quality are Lanzhou, Xinxiang, Xianyang, Hebi, Taiyuan, Linfen, Jiaozuo, Zibo, Yangquan, Shijiazhuang, Pingdingshan, Xi'an, Liaocheng, Dezhou, Weinan, Xuchang, Xingtai, Luoyang, and Zhengzhou.
From January to December, among the 168 key cities: the top 20 cities with better air quality changes were Deyang, Chengdu, Urumqi, Guiyang, Yuncheng, Yibin, Xiamen, Luzhou, Jinzhou, Meishan, Kunming, Huludao, Cangzhou, Linfen, Wuhan, Suining, Mianyang, Neijiang, Tangshan, and Zigong; and the bottom 20 cities with poorer changes were Lanzhou, Zhumazhou, and Zigong. Lanzhou, Zhumadian, Harbin, Pingdingshan, Xuchang, Shangqiu, Changsha, Luohe, Fuyang, Yiyang, Bozhou, Xiangtan, Xinzhou, Luoyang, Huainan, Nanyang, Zhengzhou, Xinxiang, Jiaozuo, and Huabei, in that order.
From January to December, among the 168 key cities: the top 20 cities with lower PM2.5 concentrations are, in order, Lhasa, Haikou, Shenzhen, Zhoushan, Huizhou, Zhuhai, Fuzhou, Xiamen, Zhangjiakou, Guiyang, Kunming, Zhongshan, Dongguan, Huangshan, Lishui, Guangzhou, Zhaoqing, Foshan, Jiangmen, and Chengde City; the bottom 20 cities with higher PM2.5 concentrations are, in order, Anyang, Hebi, Luohe, Jiaozuo, and Huaibei. The next 20 cities with higher PM2.5 concentrations are Anyang, Hebi, Luohe, Xuchang, Shangqiu, Pingdingshan, Xinxiang, Jiaozuo, Luoyang, Zhoukou, Xianyang, Lanzhou, Puyang, Kaifeng, Handan, Shijiazhuang, Zhengzhou, Xiangyang, Xingtai, and Heze.
From January to December, among the 168 key cities, the top 20 cities with better changes in PM2.5 concentration were Deyang, Chengdu, Guiyang, Linfen, Kunming, Yibin, Guang'an, Meishan, Yuncheng, Weinan, Jinzhou, Suining, Urumqi, Huludao, Xi'an, Dazhou, Huangshi, Xinyu, Mianyang, and Ya'an in that order; and the bottom 20 cities with poor changes in PM2.5 concentration were Lanzhou, Zhousheng, Zhoukou, Xianyang, Puyang, Kaifeng, Handan, Shijiazhuang, Zhengzhou, Xiangyang, Xingtai, and Heze in that order. The top 20 cities are Lanzhou, Xinzhou, Harbin, Pingdingshan, Zhumadian, Xiangtan, Jiaozuo, Fuyang, Luohe, Changsha, Shangqiu, Xuchang, Yangquan, Zhengzhou, Suzhou, Shijiazhuang, Hebi, Luoyang, Huainan and Huai'an City in that order.
Source: Ministry of Ecology and Environment


