National Ambient Air Quality Conditions for December and January-December 2023
Time:2024-02-07 Views:92 Author:
In December, the average proportion of good air quality days in 339 prefectural-level and above cities nationwide was 81.9%, a year-on-year decrease of 1.3 percentage points, and an increase of 4.9 percentage points from the same period in 2019 before the epidemic; the average proportion of days with heavy or above pollution was 3.3%, a year-on-year increase of 0.9 percentage points, and an increase of 0.1 percentage points from the same period in 2019 before the epidemic; the average PM2.5 concentration was 46 micrograms per cubic meter, up 2.2% year-on-year and down 16.4% from the same period in 2019 before the epidemic; the average concentration of O3 was 82 micrograms per cubic meter, up 3.8% year-on-year and up 5.1% from the same period in 2019 before the epidemic; the average concentration of PM10 was 71 micrograms per cubic meter, down 4.1% year-on-year; the average concentration of SO2 was 10 micrograms per cubic meter, a down 9.1% year-on-year; average NO2 concentration of 32 micrograms per cubic meter, up 6.7% year-on-year; and average CO concentration of 1.3 milligrams per cubic meter, up 18.2% year-on-year.
From January to December, the average proportion of good air quality days in 339 prefectural-level and above cities nationwide was 85.5%, and after deducting the days with abnormal exceedance of sand and dust, the actual proportion was 86.8%, which was better than the annual target by 0.6 percentage points, and up by 3.5 percentage points compared with the same period in 2019 before the epidemic (82.0%); the average proportion of days with heavy and above pollution was 1.6%, which was actually 1.1% after deducting the unusually heavy pollution days of sand and dust; the average concentration of PM2.5 was 30 micrograms per cubic meter, which was better than the annual target (32.9 micrograms per cubic meter) by 2.9 micrograms per cubic meter, and improved by 16.7% compared with the same period of 2019 prior to the epidemic (36 micrograms per cubic meter); and the average concentration of O3 was 144 micrograms per cubic meter, which was a decrease of 0.7% year-on-year, and an improvement of 16.7% compared to the the same period in 2019 before the outbreak by 2.7%; the average PM10 concentration was 53 µg/m3, up 3.9% year-on-year; the average SO2 concentration was 9 µg/m3, flat year-on-year; the average NO2 concentration was 22 µg/m3, up 4.8% year-on-year; and the average CO concentration was 1.0 mg/m3, down 9.1% year-on-year.
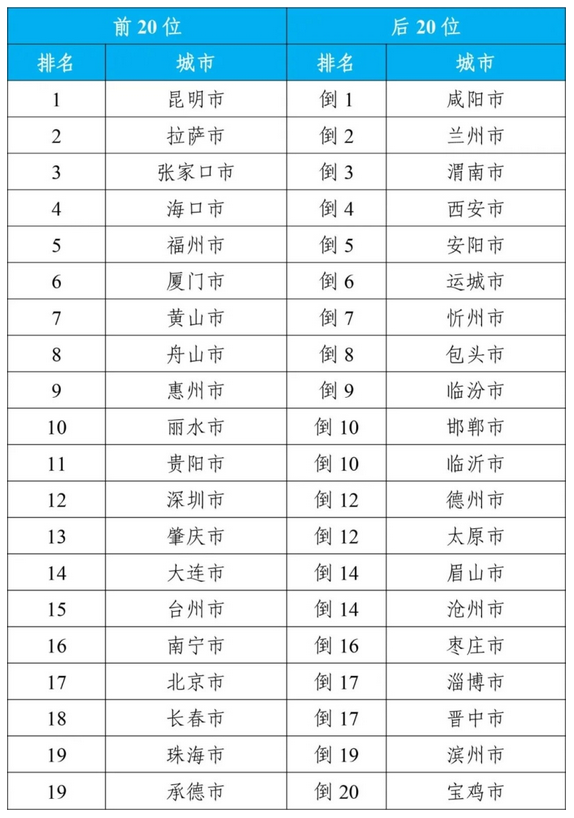
List of Top 20 and Bottom 20 Cities in Air Quality Ranking of 168 Key Cities in December 2023

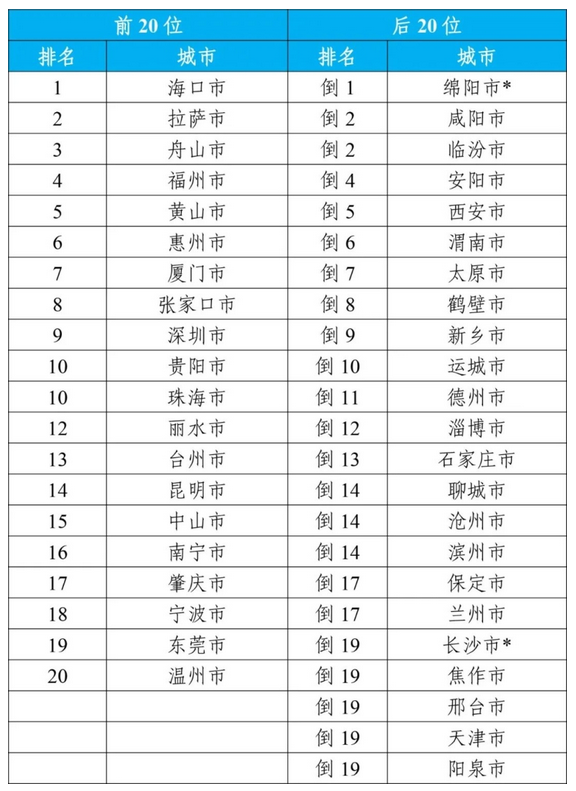
List of Top 20 and Bottom 20 Cities in terms of Air Quality among 168 Key Cities in January-December 2023


