In January, the average concentration of PM2.5 in 339 prefecture-level and above cities nationwide was 53.1 micrograms per cubic meter, up 4.7% year-on-year; the average concentration of PM10 was 80 micrograms per cubic meter, up 8.1% year-on-year; the average concentration of O3 was 98 micrograms per cubic meter, up 15.3% year-on-year; the average concentration of SO2 was 10 micrograms per cubic meter, flat year-on-year; the average concentration of NO2 was 30 micrograms per cubic meter, a year-on-year decrease of 6.2%; and the average concentration of CO was 1.2 milligrams per cubic meter, flat year-on-year.
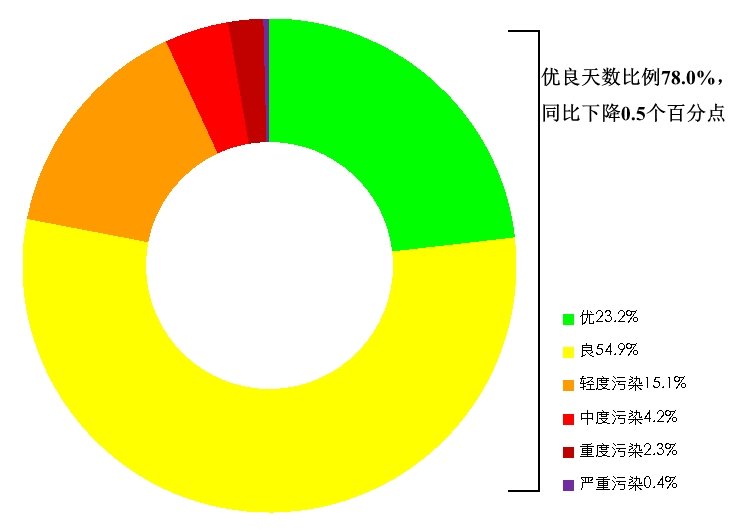
In January, the average proportion of good air quality days in 339 prefectural-level and above cities nationwide was 78.0%, a year-on-year decrease of 0.5 percentage points; the average proportion of days with heavy and above pollution was 2.6%, a year-on-year increase of 0.4 percentage points. The average proportion of days exceeding the standard caused by dusty weather was 1.1%, of which the proportion of heavily and above polluted days was 0.2%.

Proportion of days at all levels in 339 cities at prefecture level and above nationwide in January 2025
List of top 20 and bottom 20 cities of 168 key cities in terms of air quality in January 2025
In January, among the 168 key cities: the top 20 cities with better air quality were Zhangjiakou, Lhasa, Kunming, Beijing, Fuzhou, Xiamen, Zhoushan, Dalian, Chengde, Haikou, Huizhou, Lishui, Huangshan, Shenzhen, Taizhou, Guiyang, Qinhuangdao, Zhuhai, Wenzhou and Dongguan City in order; and the bottom 20 cities with poorer air quality were Harbin, Urumqi, Xianyang, Xi'an, Jingzhou and Changde in order, Xiangyang, Xiaogan, Yuncheng, Nanyang, Zhuzhou, Yiyang, Changsha, Luohe, Yichang, Zhoukou, Lanzhou, Xiangtan, Yueyang and Weinan City.
In January, among the 168 key cities: the top 20 cities with lower PM2.5 concentrations were, in order, Lhasa, Zhangjiakou, Xiamen, Beijing, Haikou, Shenzhen, Fuzhou, Kunming, Zhoushan, Huizhou, Chengde, Zhuhai, Dongguan, Dalian, Qinhuangdao, Zhongshan, Lishui, Guangzhou, Lvliang, and Zhaoqing; and the bottom 20 cities with higher PM2.5 concentrations were, in order, Harbin, Changde, Jingzhou, Urumqi, Guang'an, Yiyang, Xi'an, Xianyang, Zhoukou, Luohe, Yichang, Shangqiu, Nanyang, Xiaogan, Luzhou, Xiangyang, Xuchang, Jingmen, Fuyang and Changsha.
Source: Ministry of Ecological Environment


