In June, the average concentration of PM2.5 in 339 prefectural-level and above cities nationwide was 17 micrograms per cubic meter, a year-on-year decrease of 5.6%; the average concentration of PM10 was 35 micrograms per cubic meter, a year-on-year decrease of 5.4%; the average concentration of O3 was 152 micrograms per cubic meter, a year-on-year decrease of 8.4%; the average concentration of SO2 was 7 micrograms per cubic meter, a year-on-year decrease of 12.5%; the average concentration of NO2 was 14 micrograms per cubic meter, down 12.5% year-on-year; and the average concentration of CO was 0.7 milligrams per cubic meter, flat year-on-year.
In June, the average proportion of good air quality days in 339 prefectural-level and above cities nationwide was 78.3%, up 0.1 percentage point year-on-year; the average proportion of heavily polluted days and above was 0.2%, down 0.1 percentage point year-on-year; and the average proportion of exceeding the standard days caused by sand and dust weather was 1.0%.
From January to June, the average concentration of PM2.5 in 339 prefectural-level and above cities nationwide was 33 micrograms per cubic meter, a year-on-year decline of 2.9%; the average concentration of PM10 was 55 micrograms per cubic meter, a year-on-year decline of 9.8%; the average concentration of O3 was 147 micrograms per cubic meter, a year-on-year increase of 0.7%; the average concentration of SO2 was 8 micrograms per cubic meter, a year-on-year down 11.1%; average NO2 concentration of 21 micrograms per cubic meter, down 4.5% year-on-year; and average CO concentration of 1.1 milligrams per cubic meter, flat year-on-year.
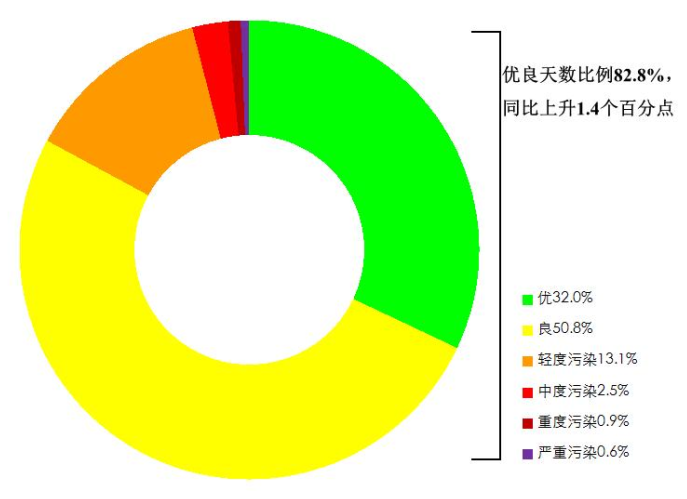
From January to June, the average proportion of good air quality days in 339 prefecture-level and above cities nationwide was 82.8%, up 1.4 percentage points year-on-year; the average proportion of heavily polluted days and above was 1.5%, down 1.1 percentage points year-on-year; and the average proportion of days exceeding the standard caused by dust and sandy weather was 3.2%.

Proportion of days at all levels in 339 cities at prefecture level and above nationwide, January-June 2024
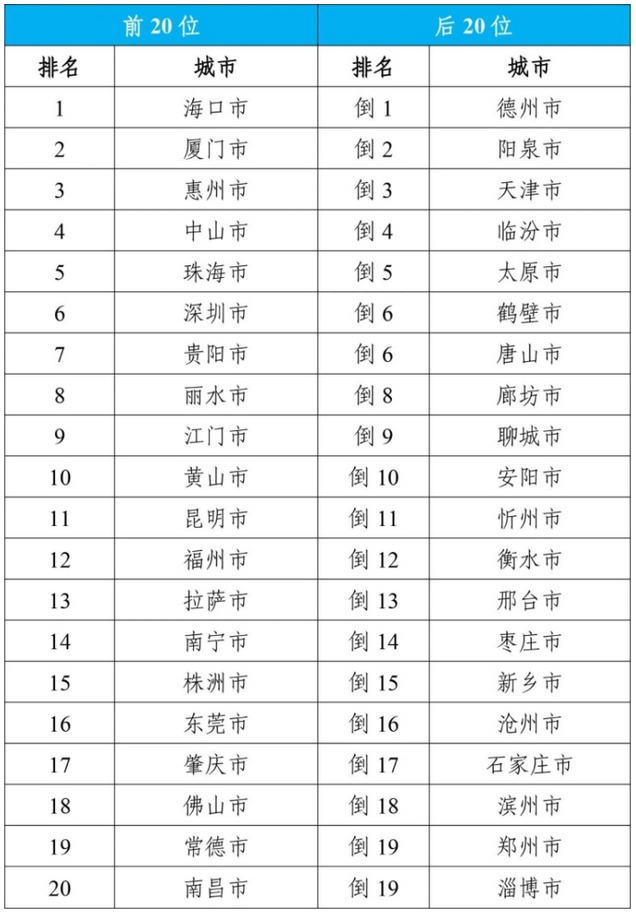
List of top 20 and bottom 20 cities in terms of air quality in 168 key cities in June 2024

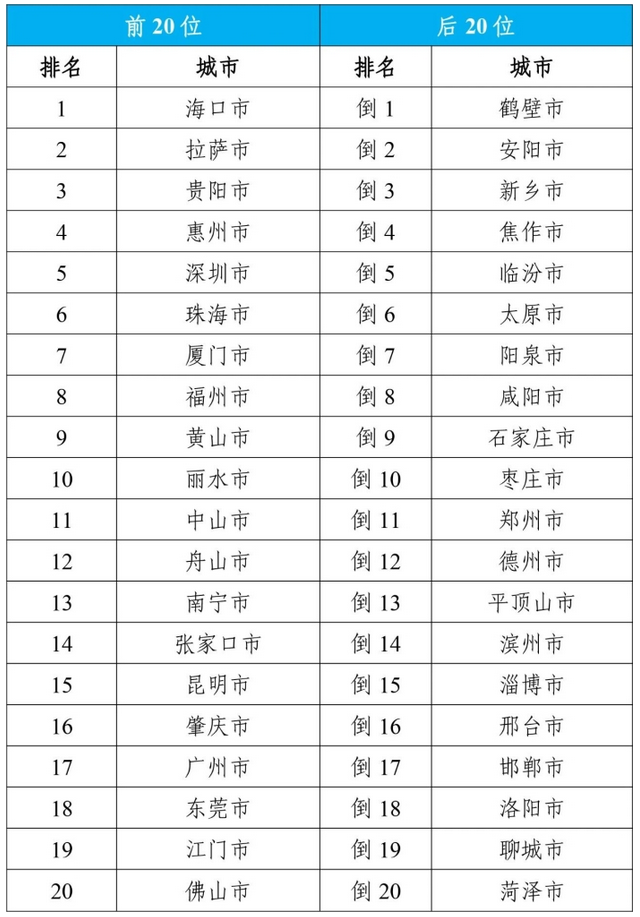
List of Top 20 and Bottom 20 Cities in Air Quality Ranking of 168 Key Cities in January-June 2024

Source: Ministry of Ecology and Environment


